Task 2 Part D#
Part D of the documentation explains the technical details of your project and should target the computer science subject matter experts. Hence, of the documentation, part D is most valued and scrutinized by the evaluators. Of part D, the User Guide, Machine Learning, and Validation sections are the most important. As such, we recommend completing these sections first. Follow the Task 2 Template.
User Guide#
The evaluator might go here first. Following your instructions, they will verify your app functions as intended and simultaneously gain context of its purpose through demonstration.
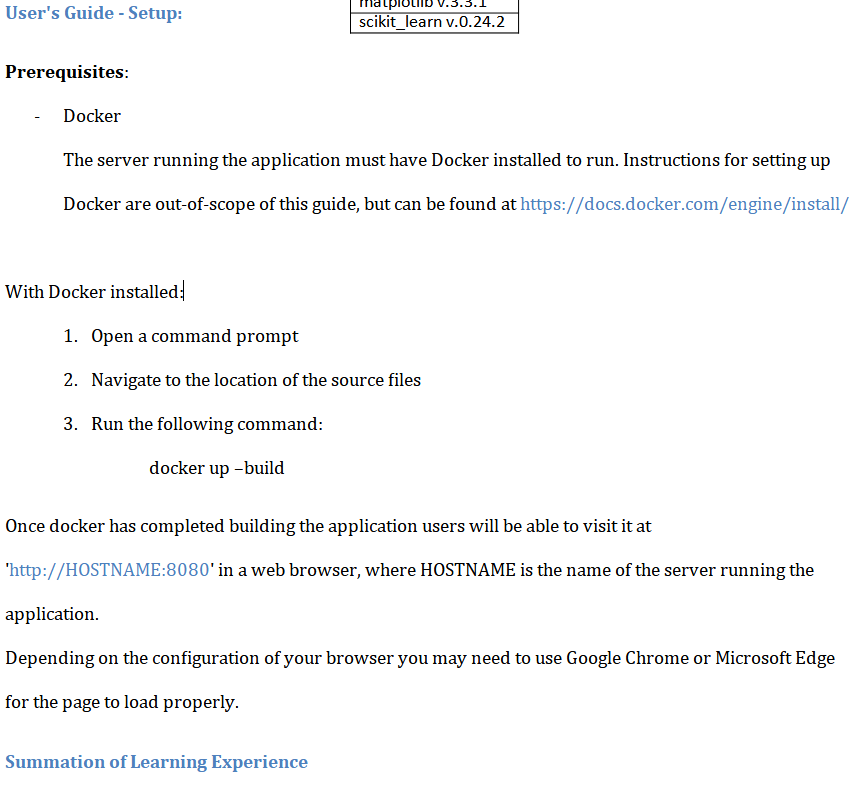
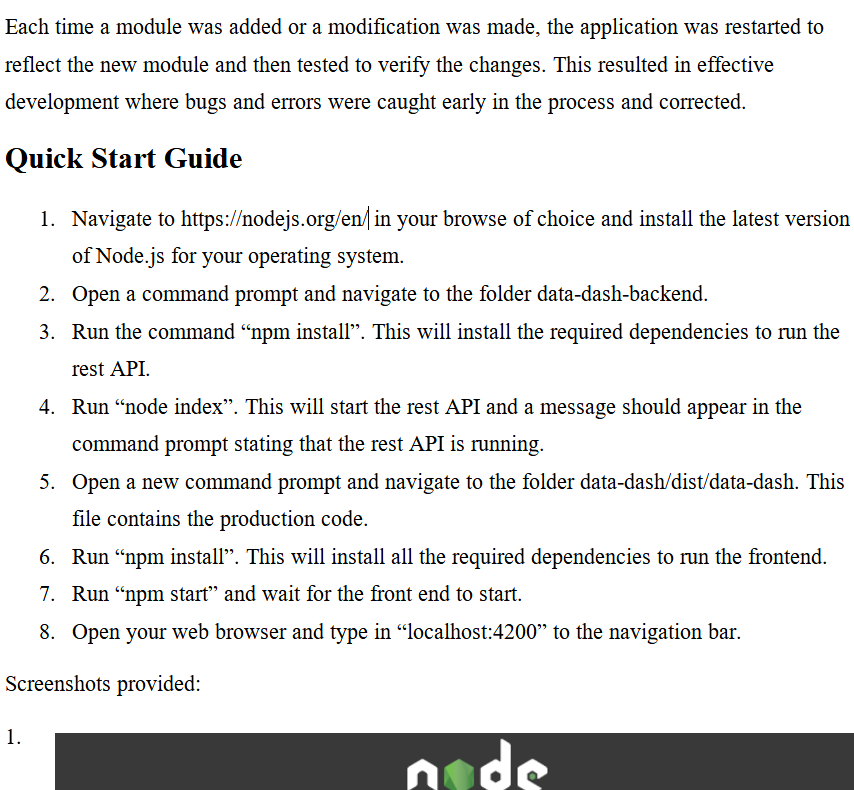
Include an enumerated (steps 1, 2, 3, etc.) guide on how to execute and use your application. The evaluator will play the “client” role and follow your instructions as provided. So you should include instructions for downloading and installing any necessary software or libraries (they’ll have most of these installed anyway). Your application will be considered “user-friendly” if the evaluator successfully executes and uses your application on a Windows 10 machine following your instructions.
Provide examples. Examples not only make the instructions easier to follow (hence easier to pass) but also demonstrate how the app solves the organizational need. When applicable provide sample input or input which can be copied and pasted.
Provide visual aides. Screenshots or even a Panotpo video would all be great ways in aiding the evaluator’s understanding of your project.
Test. Create a new environment or borrow a friend’s computer, follow your instructions verbatim, and verify that everything works as expected. It’s easy to overlook small details.


Machine Learning#
This section should describe the development of your ML application justifying and explaining decisions made in the process. Explain the what, how, and why of the machine learning model and its application.
What? Outline what your product does and then explain in detail what machine learning does in solving the proposed problem. Describe the algorithms, libraries, and other tools used to develop the machine learning model. Consider including an example of your model’s output.
How? Outline your application’s implementation plan and then explain in detail how the machine learning portion was developed (or trained) and improved.
Why? Thoroughly justify development decisions. Address your algorithm(s) as a good choice, why your training process was appropriate, etc.
Validation#
In this section, discuss how you assessed the success of the ML application(s). Identify the model’s machine learning category, e.g., supervised, unsupervised, or reinforced. For blended approaches, identify the category most relevant to the model’s application, and describe an appropriate validation method for the model’s performance
In most cases, this means providing an appropriate metric. Most libraries have builtins for this; see sklearn metrics. When no such metric is available or appropiate successful examples of the model’s output should be provided.
Note
There is no minimal accuracy requirement. At most, evaluators will assess the appropriateness of the metric (or planned metric).
Supervised Methods#
Describe an appropriate metric(s) for testing the model’s performance.
Provide results of testing using the described metric.
Classification#
The metric for measuring a supervised classification model’s accuracy is straightforward. We use the ratio of correct to total predictions:
Though no minimal accuracy is required, your model should perform better than randomly selecting categories, e.g., the model predicting 1 of 3 flower types should perform better than \(\frac{1}{3} = 33.3\bar{3}\%\).
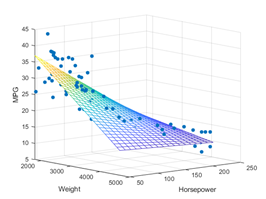
Regression Methods#
As regression models estimate continuous values, they rarely exactly match actual values. Thus success of the model is measured by how closely the model fits the data. Common metrics include mean square error (MSE), mean absolute error (MAE), and mean absolute percentage error (MAPE). Statistical metrics such as the correlation coefficient or (more commonly) the coefficient of determination, \(R^{2}\), can be used. See sklearn’s regression metric documentation. As above there is no performance benchmark, but the model should at predict at least as well as thaking the mean.
Unsupervised Methods#
Depending on the method, metrics might similarly be used for unsupervised models, such as Silhouette coefficients for KMeans clustering or collabartoive filtering accuracy score.
Describe an appropriate method(s) for testing the model’s performance.
Provide the results of testing using the above method, providing an appropriate example of the model’s output, or a metric measuring the model’s performance, e.g., the Rand index, collaborative filtering accuracy, or Silhouette Coefficient
Reinforced Learning Methods#
Reinforced learning methods seek to optimize an outcome, e.g., the C950 delivery app seeks to minimize miles driven. The better this outcome, the better your algorithm.
Describe what is being optimized and how it is measured.
Provide the results of the agent interacting with the environment. Describe or provide examples of the actions, environment, and states when appropriate.
Solution Summary#
Summarize the problem and solution. Describe how the application (Part C) supports a solution to the problem presented in parts A and B.
Data Summary#
Provide the source of the rwa data, how the data was collected, or how it was simulated. Include a description of how data was processed and managed throughtout the application development life cycle: design, development, maintenance, or others.
Visualizations#
Identify the location of at least three unique imgaes in part C. Part or all of those images can also be included in this section. Tehcnically, the visualizations are required to be part of the application. However, often this is not desirable, say when the app is intended to customer facing. So it is allowable to submit the code provindg the visualization separate from the main application code. Recall, images can be generated by the code or inserted as static images.